

In today’s competitive business landscape, customer success has evolved from a support function into a critical revenue driver. Recent research from McKinsey reveals that top-quartile performers achieve 14 to 23 percentage points lower net-revenue churn than their peers, while Pendo’s 2026 benchmarks show that software products lose 70% of users over three months [1][2]. These stark statistics underscore a fundamental truth: organizations that master customer success metrics don’t just retain customers—they unlock sustainable growth and competitive advantage in an increasingly retention-focused economy.
Why Customer Success Metrics Matter in 2026
The business world has undergone a fundamental shift from acquisition-centric to retention-focused models, driven by economic pressures and evolving customer expectations. This transformation is particularly pronounced in the software-as-a-service (SaaS) industry, where subscription-based revenue models have made customer retention the primary determinant of long-term success.
Economic headwinds have intensified the focus on existing customer value. With customer acquisition costs rising across industries and venture capital becoming more selective, organizations can no longer rely solely on new customer acquisition to drive growth. The Technology Services Industry Association (TSIA) reports that customer success is no longer just a support function but a powerhouse that can drive efficiencies and revenue growth [3]. This shift has elevated customer success metrics from operational dashboards to boardroom discussions, making them essential tools for strategic decision-making.
The integration of artificial intelligence and automation technologies is revolutionizing how organizations measure and manage customer success. AI-driven predictive analytics now enable companies to identify at-risk customers before churn occurs, while automated customer health scoring provides real-time insights into customer satisfaction and engagement levels. However, this technological advancement also presents challenges, as organizations must balance the efficiency gains of automation with the personal touch that drives customer loyalty.
Furthermore, the democratization of customer success across all customer segments has become crucial. TSIA research emphasizes that effective customer management across all segments—including high-touch, medium-touch, and the often-overlooked “long tail” segments—is of paramount importance in 2024 and beyond [3]. This comprehensive approach requires sophisticated measurement frameworks that can scale across diverse customer bases while maintaining actionable insights.
The Customer Success Metrics Hierarchy
Understanding customer success requires a structured approach to measurement that distinguishes between different types of indicators. McKinsey’s research on customer success emphasizes the importance of segmenting metrics into three distinct categories: lagging indicators, activity indicators, and leading indicators [1]. This hierarchical framework provides organizations with a comprehensive view of customer health while enabling proactive intervention strategies.
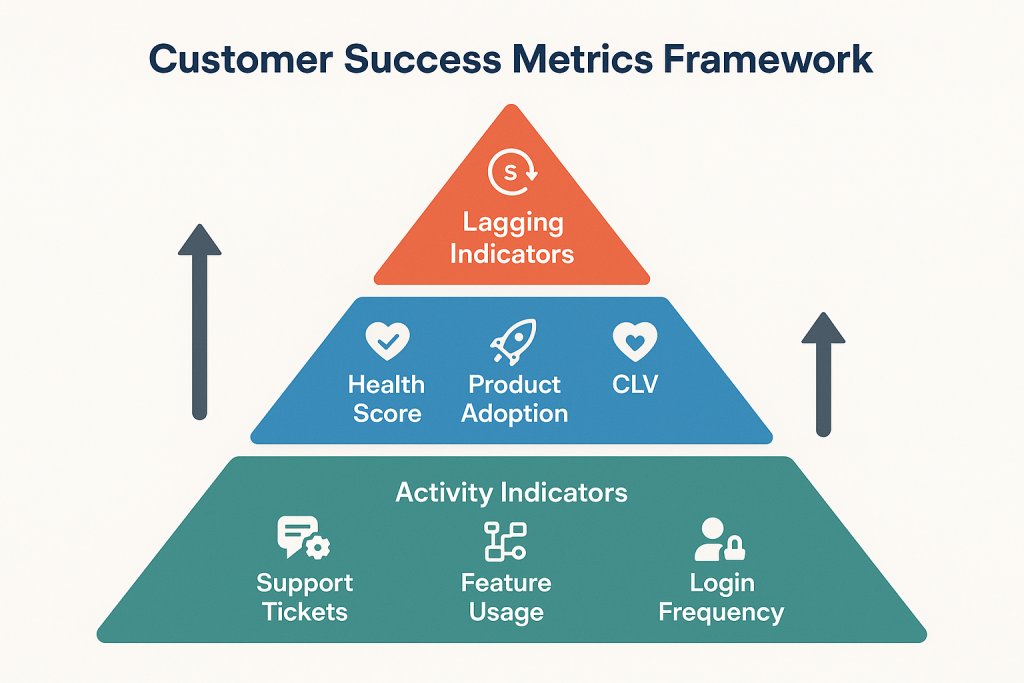
Lagging indicators represent the ultimate outcomes of customer success efforts. These metrics, including churn rate, net revenue retention, and customer lifetime value, provide definitive measures of success but offer limited opportunity for immediate intervention. While lagging indicators are essential for measuring overall performance and communicating results to stakeholders, they function more as report cards than actionable insights for day-to-day customer success operations.
Leading indicators serve as predictive measures that signal future customer behavior and outcomes. Customer health scores, product adoption rates, and time-to-value metrics fall into this category, providing customer success teams with early warning systems for potential churn or expansion opportunities. Research from academic institutions studying customer success management emphasizes that leading indicators are most critical for operational teams, as they enable proactive interventions that can influence lagging indicator outcomes [4].
Activity indicators form the foundation of the measurement hierarchy, tracking specific customer behaviors and engagement patterns. These metrics include login frequency, feature usage depth, support ticket volume, and user onboarding completion rates. While activity indicators may seem granular, they provide the raw data necessary to calculate leading indicators and ultimately influence lagging outcomes.
| Metric Type | Purpose | Examples | Actionability |
|---|---|---|---|
| Lagging Indicators | Measure final outcomes and results | Churn rate, NRR, CLV, Revenue growth | Low – Historical data |
| Leading Indicators | Predict future outcomes | Health score, Product adoption, Time to value | High – Predictive insights |
| Activity Indicators | Track specific behaviors | Login frequency, Feature usage, Support tickets | Medium – Operational data |
The effectiveness of this hierarchical approach lies in its ability to provide both strategic oversight and tactical guidance. Executive teams can focus on lagging indicators to assess overall performance and make strategic decisions, while customer success managers use leading and activity indicators to guide daily operations and intervention strategies. However, organizations must resist the temptation to over-optimize for any single metric type, as this can lead to unbalanced approaches that sacrifice long-term customer relationships for short-term gains.
Implementation challenges often arise when organizations attempt to track too many metrics simultaneously or fail to establish clear connections between different indicator types. Research suggests that successful customer success programs typically focus on 5-7 core metrics across all three categories, ensuring that teams can maintain focus while capturing comprehensive customer insights [4]. The key is selecting metrics that align with business objectives while providing actionable insights for customer success teams.
Critical Retention and Churn Metrics
Retention and churn metrics represent the most fundamental measures of customer success, directly correlating with revenue sustainability and growth potential. McKinsey’s comprehensive analysis of 200 growth-stage SaaS businesses reveals significant performance variations across different customer segments, with top-quartile performers consistently outpacing their peers through superior retention strategies [1].
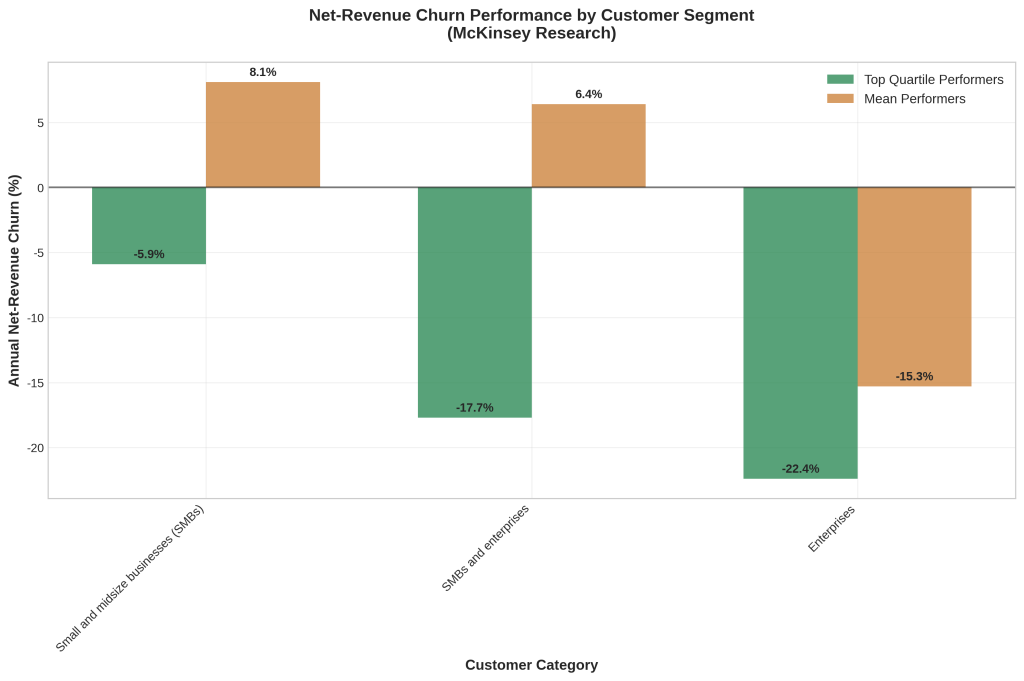
Net-revenue churn emerges as the most comprehensive metric for measuring customer success performance, as it captures both the dollar value lost from churning customers and the dollar value gained from expansion revenue. McKinsey’s research demonstrates that top-quartile performers achieve negative net-revenue churn across all customer categories, indicating that expansion revenue from existing customers exceeds losses from churn [1]. This achievement represents the holy grail of customer success: a customer base that grows in value over time without requiring new customer acquisition.
The performance gaps between top-quartile and mean performers are particularly striking in the SMBs and enterprises category, where top performers achieve a 24.1 percentage point advantage. This substantial difference suggests that companies serving mixed customer bases face unique challenges in balancing the distinct needs of small businesses and enterprise clients. Successful organizations in this category typically implement segmented customer success strategies that acknowledge the different resource requirements and success patterns of each customer type.
Gross-revenue churn provides additional insights into the underlying drivers of net-revenue performance. McKinsey’s analysis reveals that top-quartile performers achieve their superior net-revenue churn primarily through advantages in gross-revenue churn rather than expansion revenue alone [1]. This finding challenges the common assumption that expansion revenue is the primary driver of negative net-revenue churn, instead highlighting the critical importance of customer retention fundamentals.
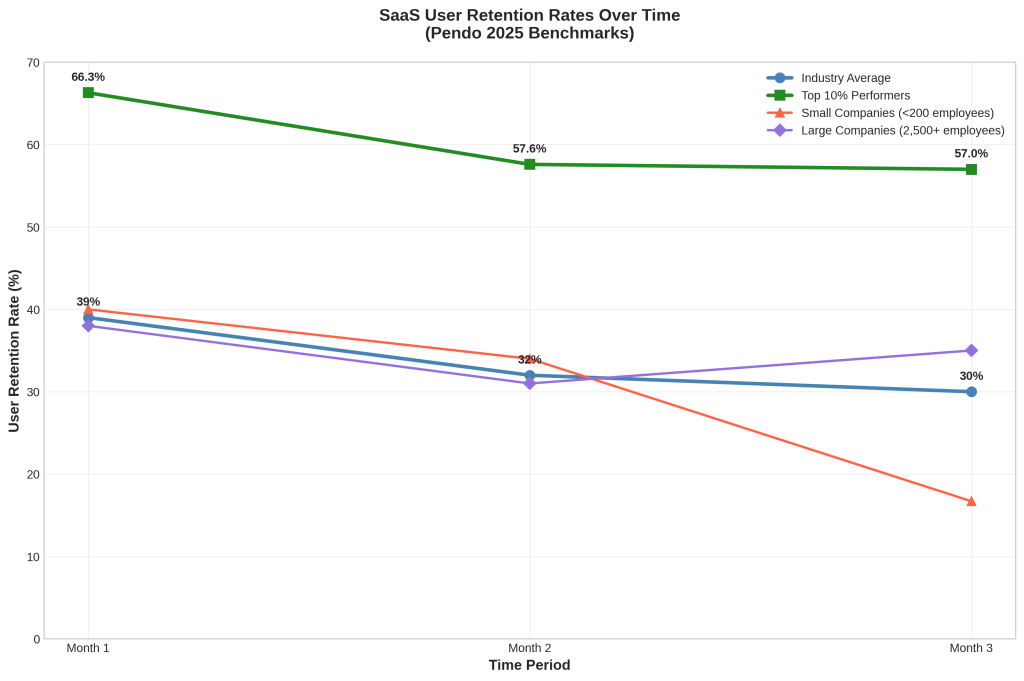
Industry benchmarks for retention rates vary significantly across sectors and business models. Pendo’s 2026 research indicates that software products retain an average of 39% of users after one month, declining to approximately 30% after three months [2]. However, these user retention rates differ substantially from customer retention rates, particularly in B2B environments where multiple users may represent a single customer account.
The distinction between user retention and customer retention becomes particularly important when analyzing B2B SaaS metrics. While user retention measures individual engagement with the product, customer retention reflects the business relationship and financial commitment. Organizations must track both metrics to gain comprehensive insights into product adoption and business sustainability. Research indicates that B2B companies typically maintain customer retention rates between 80-90%, significantly higher than user retention rates, due to contractual commitments and switching costs [5].
Company size significantly influences retention patterns, with smaller companies (<200 employees) demonstrating higher user retention in the first two months but lower retention in month three compared to larger enterprises. This pattern suggests that smaller companies may achieve initial user engagement more effectively but struggle with long-term user adoption and value realization. Conversely, larger enterprises may have slower initial adoption due to complex organizational structures but achieve better long-term retention through systematic implementation and change management processes.
Churn prediction and prevention strategies have evolved significantly with the integration of machine learning and predictive analytics. Leading organizations now employ sophisticated models that analyze hundreds of behavioral and engagement variables to identify at-risk customers weeks or months before churn occurs. However, the effectiveness of these predictive models depends heavily on data quality and the organization’s ability to act on early warning signals through proactive customer success interventions.
Customer Lifetime Value and Revenue Metrics
Customer Lifetime Value (CLV) represents one of the most strategic metrics in customer success measurement, providing a forward-looking assessment of customer relationships that extends beyond immediate revenue considerations. CLV calculations enable organizations to make informed decisions about customer acquisition investments, retention strategies, and resource allocation across different customer segments. Research from CustomerGauge reveals significant variations in average CLV across industries, reflecting the diverse nature of business models and customer relationships [6].
| Industry | Average CLV | CAC:CLV Ratio | Typical Contract Length |
|---|---|---|---|
| Architecture firm | $1,130,000 | 4:1 | 24 months |
| Business consultancy | $385,000 | 3:1 | 18 months |
| Healthcare consultancy | $330,000 | 3:1 | 12 months |
| Insurance company | $321,000 | 5:1 | 36 months |
| Software company | $240,000 | 3:1 | 12 months |
| B2B financial advice | $164,000 | 3:1 | 24 months |
| Digital design | $90,000 | 3:1 | 6 months |
The Customer Acquisition Cost to Customer Lifetime Value (CAC:CLV) ratio serves as a fundamental metric for assessing business model sustainability and growth potential. Industry consensus establishes a 3:1 ratio as the minimum benchmark for healthy business operations, indicating that customers should generate three times their acquisition cost over their lifetime [7]. However, leading organizations often achieve ratios of 4:1 or higher, providing greater margins for investment in customer success initiatives and business growth.
B2B organizations typically demonstrate higher CLV figures compared to B2C companies due to several structural factors. B2B relationships generally involve longer customer lifetimes, higher transaction values, and greater switching costs that contribute to improved retention rates. CustomerGauge research indicates that B2B brands typically have fewer customers and therefore need to extract more value from each relationship, leading to more intensive customer success investments and higher resulting CLV figures [6].
Monthly Recurring Revenue (MRR) and Annual Recurring Revenue (ARR) provide complementary metrics that track revenue momentum and growth trends. These metrics become particularly valuable when segmented by customer cohorts, enabling organizations to identify patterns in customer behavior and revenue generation over time. Cohort analysis reveals how different customer segments contribute to overall revenue growth and helps identify the most valuable customer acquisition channels and strategies.
Net Revenue Retention (NRR) represents a critical metric that combines retention and expansion elements into a single measure. NRR calculations include revenue from existing customers, accounting for churn, downgrades, and expansion revenue from upsells and cross-sells. Leading SaaS companies typically achieve NRR rates above 110%, indicating that existing customers generate more revenue over time even after accounting for churn losses [8].
The calculation and interpretation of CLV metrics present several challenges that organizations must address to ensure accurate measurement. Traditional CLV models often rely on historical data and may not account for changing customer behavior patterns or market conditions. Advanced organizations are increasingly adopting predictive CLV models that incorporate machine learning algorithms to forecast future customer behavior based on current engagement patterns and external factors.
Revenue concentration risk represents an often-overlooked aspect of CLV analysis that can significantly impact business sustainability. Organizations with high CLV figures may face substantial risk if their revenue is concentrated among a small number of high-value customers. Diversification strategies that balance high-value enterprise customers with a broader base of smaller accounts can provide more stable revenue streams while maintaining healthy overall CLV metrics.
The integration of CLV metrics with customer success operations requires sophisticated data infrastructure and analytical capabilities. Organizations must establish systems that can track customer interactions, product usage, and financial transactions across multiple touchpoints and time periods. This comprehensive data collection enables more accurate CLV calculations and provides customer success teams with the insights necessary to optimize customer relationships for long-term value creation.
Operational and Engagement Metrics
Operational and engagement metrics provide the granular insights necessary for day-to-day customer success management, enabling teams to identify opportunities for intervention and optimization before they impact higher-level business metrics. These metrics bridge the gap between customer behavior and business outcomes, offering actionable data that customer success managers can use to guide their interactions and strategies with individual accounts.
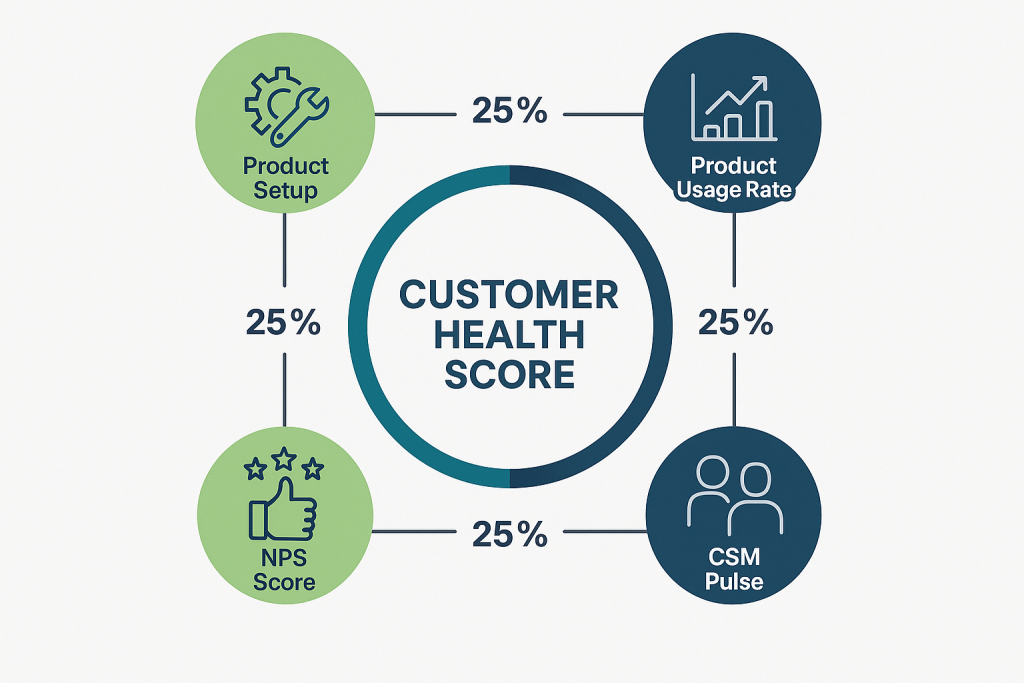
Customer health scores represent composite metrics that synthesize multiple engagement and behavioral indicators into a single, actionable measure. Research from Vitally identifies a four-metric framework that provides balanced, predictive insights into customer engagement: Product Setup, Product Usage Rate, Net Promoter Score (NPS), and Customer Success Manager (CSM) Pulse [9]. This framework acknowledges that customer health encompasses both quantitative behavioral data and qualitative relationship assessments.
Product setup completion serves as a foundational metric that correlates strongly with long-term customer success. Customers who complete comprehensive onboarding and configuration processes demonstrate higher retention rates and greater lifetime value compared to those with incomplete implementations. However, organizations must balance setup complexity with user experience, as overly complex onboarding processes can create barriers to adoption and early value realization.
Product usage rate metrics provide insights into customer engagement depth and breadth, indicating how effectively customers are leveraging available functionality to achieve their business objectives. Leading organizations track not only usage frequency but also feature adoption patterns, user distribution across accounts, and progression through value-driving workflows. These granular usage metrics enable customer success teams to identify expansion opportunities and potential churn risks based on engagement patterns.
Time-to-value (TTV) metrics measure the duration between customer onboarding and the achievement of meaningful business outcomes. TTV varies significantly across industries and product types, but research consistently demonstrates that customers who achieve value quickly are more likely to remain engaged and expand their usage over time. Organizations must define value achievement criteria that align with customer objectives while remaining measurable and achievable within reasonable timeframes.
Net Promoter Score (NPS) provides a standardized measure of customer satisfaction and advocacy potential that enables benchmarking across industries and time periods. While NPS has limitations as a standalone metric, it serves as a valuable component of comprehensive health scoring systems. Academic research on customer success management emphasizes that NPS should be combined with behavioral metrics to provide a complete picture of customer health [4].
Support ticket volume and resolution patterns offer insights into customer experience quality and potential friction points within the product or service delivery. However, organizations must interpret support metrics carefully, as high ticket volumes may indicate either product issues or high customer engagement levels. Advanced analytics can help distinguish between different types of support interactions and their implications for customer health.
User adoption metrics track how effectively customers are expanding their usage of available features and capabilities over time. Successful customer success programs typically demonstrate progressive adoption patterns, where customers gradually increase their usage depth and breadth as they become more familiar with the product. Stagnant adoption patterns often signal potential churn risks or opportunities for additional training and support.
Engagement scoring systems combine multiple behavioral indicators to create comprehensive assessments of customer activity levels. These systems typically weight different activities based on their correlation with positive outcomes, creating nuanced measures that reflect the complexity of customer relationships. However, organizations must regularly validate and update their scoring algorithms to ensure continued accuracy and relevance.
The challenge of operational metrics lies in balancing comprehensiveness with actionability. Customer success teams require sufficient detail to guide their interventions while avoiding information overload that can paralyze decision-making. Leading organizations typically implement tiered reporting systems that provide high-level dashboards for strategic oversight and detailed drill-down capabilities for operational management.
Integration challenges often arise when attempting to combine data from multiple systems and touchpoints into coherent operational metrics. Customer success platforms must aggregate information from CRM systems, product analytics tools, support platforms, and financial systems to provide comprehensive customer insights. This integration complexity requires significant technical investment and ongoing maintenance to ensure data accuracy and reliability.
Visual Framework: The Customer Success Measurement Model
Effective customer success measurement requires a comprehensive framework that integrates multiple metric types while maintaining focus on actionable insights and business outcomes. The hierarchical model presented earlier provides the structural foundation, but successful implementation requires additional considerations around metric selection, data integration, and organizational alignment.
The balanced scorecard approach to customer success metrics ensures that organizations maintain perspective across multiple dimensions of customer relationships. This approach typically includes financial metrics (revenue, profitability), customer metrics (satisfaction, retention), operational metrics (efficiency, quality), and learning metrics (capability development, innovation). By balancing these perspectives, organizations avoid the tunnel vision that can result from over-optimizing single metrics at the expense of overall customer relationships.
Metric interdependencies represent a critical consideration that many organizations overlook when designing measurement frameworks. Customer health scores influence retention rates, which impact lifetime value calculations, which affect acquisition investment decisions. Understanding these relationships enables more sophisticated analysis and prevents unintended consequences from metric optimization efforts.
The customer lifecycle integration ensures that metrics remain relevant and actionable across different stages of the customer journey. Onboarding metrics focus on setup completion and early value realization, while mature customer metrics emphasize expansion opportunities and advocacy development. This lifecycle approach prevents organizations from applying inappropriate metrics to different customer segments or journey stages.
Implementation Action Plan
Successful customer success metrics implementation requires a systematic approach that addresses technical infrastructure, organizational capabilities, and change management considerations. Organizations should begin with a comprehensive assessment of current measurement capabilities and identify gaps that must be addressed to support effective customer success operations.
The first step involves establishing clear metric definitions and calculation methodologies that ensure consistency across teams and time periods. This standardization process should include documentation of data sources, calculation formulas, and interpretation guidelines that enable accurate and consistent measurement. Organizations must also establish data governance processes that maintain metric integrity as systems and processes evolve over time.
Technology infrastructure development typically requires integration across multiple systems and platforms to provide comprehensive customer insights. Customer success platforms, CRM systems, product analytics tools, and financial systems must be connected through APIs or data warehouses that enable real-time or near-real-time reporting. This integration complexity often requires significant technical investment and ongoing maintenance resources.
Team training and capability development ensure that customer success professionals can effectively interpret and act on metric insights. This training should cover both technical aspects of metric calculation and strategic considerations around metric interpretation and action planning. Organizations should also establish regular review processes that enable continuous improvement in metric utilization and effectiveness.
Common implementation pitfalls include attempting to track too many metrics simultaneously, failing to establish clear accountability for metric outcomes, and neglecting to validate metric accuracy and relevance over time. Successful organizations typically start with a focused set of core metrics and gradually expand their measurement capabilities as teams develop proficiency and systems mature.
Future Outlook: Trends and Challenges
The future of customer success metrics will be shaped by advancing artificial intelligence capabilities, evolving privacy regulations, and changing customer expectations around personalization and value delivery. AI-driven predictive analytics will enable more sophisticated forecasting of customer behavior and outcomes, while machine learning algorithms will automate many routine measurement and analysis tasks.
Privacy and data collection challenges will require organizations to balance comprehensive measurement with customer privacy expectations and regulatory requirements. The increasing focus on data minimization and consent management will force organizations to be more strategic about data collection and usage, potentially limiting the granularity of behavioral tracking that has traditionally supported customer success metrics.
Real-time measurement capabilities will become increasingly important as customer expectations for immediate value delivery continue to rise. Organizations will need to develop systems that can detect and respond to customer issues or opportunities within hours or days rather than weeks or months. This real-time capability will require significant investments in data infrastructure and analytical capabilities.
Key Takeaways
- Top-quartile performers achieve 14-23 percentage points lower net-revenue churn than mean performers across all customer segments, with the largest gaps in mixed SMB and enterprise categories (McKinsey research).
- Software products lose 70% of users over three months, but top 10% performers retain 1.7-1.9x more customers than average, demonstrating the significant impact of superior customer success strategies (Pendo 2026 benchmarks).
- Customer Lifetime Value varies dramatically by industry, ranging from $90,000 in digital design to $1.13 million in architecture firms, with most industries maintaining 3:1 CAC:CLV ratios as the minimum viability threshold.
- Comprehensive health scoring using four balanced components (Product Setup, Usage Rate, NPS, and CSM Pulse) provides more predictive insights than single-metric approaches for identifying churn risks and expansion opportunities.
Frequently Asked Questions
What is the difference between user retention and customer retention?
User retention measures how many individual users return to your software over time, while customer retention measures how many customer accounts continue their business relationship. In B2B environments, a single customer account may have multiple users, making customer retention typically higher than user retention due to contractual commitments and switching costs.
How often should customer health scores be calculated and reviewed?
Customer health scores should be calculated at least weekly for operational purposes, with daily updates for high-risk or high-value accounts. However, the review frequency should align with your customer success team’s capacity to act on insights—more frequent updates are only valuable if teams can respond appropriately to changes.
What is considered a good Net Revenue Retention rate?
Leading SaaS companies typically achieve NRR rates above 110%, indicating that existing customers generate more revenue over time even after accounting for churn. Rates above 120% are considered excellent, while rates below 100% indicate that churn and downgrades exceed expansion revenue.
How do you calculate Customer Lifetime Value for subscription businesses?
For subscription businesses, CLV is typically calculated as (Average Revenue Per User × Gross Margin %) ÷ Churn Rate. However, more sophisticated models incorporate factors like expansion revenue, discount rates, and customer acquisition costs to provide more accurate long-term value projections.
What are the most common mistakes in customer success metrics implementation?
Common mistakes include tracking too many metrics without clear action plans, failing to establish consistent definitions across teams, neglecting to validate metric accuracy over time, and focusing solely on lagging indicators without developing leading indicator capabilities.
How can small companies implement customer success metrics with limited resources?
Small companies should start with 3-5 core metrics that directly align with business objectives, leverage existing tools and integrations where possible, and focus on manual processes initially while building toward automated solutions as resources allow. The key is starting simple and expanding systematically rather than attempting comprehensive measurement from the beginning.
References
- McKinsey & Company. (2016). Grow fast or die slow: Focusing on customer success to drive growth. McKinsey High Tech Practice.
- Pendo. (2025). SaaS churn and user retention rates: 2025 global benchmarks. Pendo Blog.
- Technology Services Industry Association. (2024). The State of Customer Success 2024. TSIA Research.
- Hochstein, B., Rangarajan, D., Mehta, N., & Petkova, B. (2020). An industry/academic perspective on customer success management. Journal of Service Research, 23(1), 4-9.
- UserPilot. (2025). Average Customer Retention Rate By Industry & How to Improve. UserPilot Blog.
- CustomerGauge. (2024). Average Customer Lifetime Value by Industry (Updated for 2025). CustomerGauge Blog.
- First Page Sage. (2025). The LTV to CAC Ratio Benchmark. First Page Sage.
- Mosaic. LTV to CAC Ratio: What SaaS Businesses Need to Know. Mosaic Financial Metrics.
- Vitally. (2025). Simplifying Your Customer Health Scores with Four Key Metrics. Vitally Blog.