

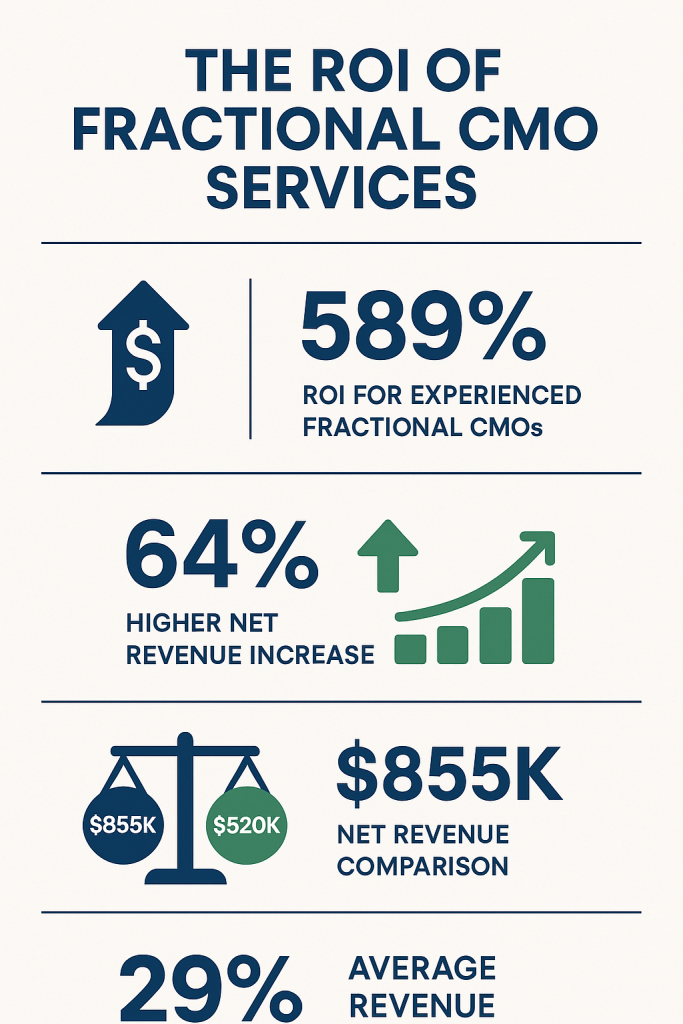
In an era where marketing accountability has never been more critical, fractional Chief Marketing Officers (CMOs) face the unique challenge of delivering measurable results within compressed timeframes and limited resources. Recent research from Harvard Business School reveals that only 23% of marketers are confident they track the right key performance indicators (KPIs), while experienced fractional CMOs demonstrate an average return on investment of 589% compared to 550% for less experienced practitioners [1].
The fractional CMO market has experienced remarkable growth, with a 168% increase from 2011 to 2024, yet these professionals represent just 1.3% of total CMO positions [2]. This scarcity underscores the importance of selecting and monitoring the right performance metrics to maximize impact. Companies utilizing fractional CMOs report an average revenue growth rate of 29%, significantly outpacing the 19% growth rate of organizations without specialized marketing leadership [3].
This analysis examines ten essential KPIs that fractional CMOs must monitor to ensure strategic success, drawing from authoritative sources including Harvard Business School research, HubSpot’s State of Marketing Report, Databox industry benchmarks, and Forbes business analysis. Each metric is evaluated through the lens of industry benchmarks, implementation challenges, and measurable business impact.
The Strategic Context: Why KPIs Matter for Fractional CMOs in 2025
The fractional CMO model has emerged as a strategic response to the evolving demands of modern marketing leadership. Unlike traditional full-time executives, fractional CMOs operate within unique constraints that make performance measurement both more challenging and more critical. According to Forbes research, the median salary differential between strategic marketing leadership (Marketing Vice President at $268,663) and tactical execution (Marketing Supervisor at $98,200) demonstrates a 2.5x premium for strategic expertise [4].
The compressed engagement timeline typical of fractional arrangements—often ranging from six months to two years—necessitates rapid identification of performance bottlenecks and optimization opportunities. Harvard Business School Professor Sunil Gupta emphasizes that “it isn’t enough to measure the final outcome alone. You also need to track intermediate metrics to understand where consumers might be getting stuck—essentially bottlenecks in the marketing funnel” [1]. This insight becomes particularly relevant for fractional CMOs who must demonstrate value quickly while building sustainable marketing systems.
Current market dynamics further amplify the importance of precise KPI selection. HubSpot’s 2025 State of Marketing Report reveals that 63% of consumers prefer to find information about brands and products on mobile devices, while most marketers report that mobile devices account for over half of their annual traffic [5]. This shift toward mobile-first engagement requires fractional CMOs to prioritize metrics that accurately reflect cross-device customer journeys and attribution challenges.
The proliferation of marketing technology has created both opportunities and complexities for performance measurement. With over 93.9% of global mobile search market share controlled by Google, and 32.9% of internet users discovering new brands through search engines, fractional CMOs must navigate an increasingly sophisticated attribution landscape [5]. The challenge is compounded by the fact that 75% of marketers believe AI-enabled search engines will positively impact their blogs, while 68% predict increased site traffic from AI integration [5].
Industry benchmarks provide essential context for fractional CMO performance evaluation. Databox research analyzing 15 industries reveals significant variation in key metrics: website sessions range from 1.56K in construction to 27.05K in apparel and footwear, while engagement rates span from 52.43% in consulting services to 63.86% in eCommerce [6]. These variations underscore the importance of industry-specific benchmarking rather than universal KPI targets.
The financial stakes of effective KPI management are substantial. Forbes analysis demonstrates that experienced fractional CMOs generate 64% higher net revenue increases compared to less experienced practitioners, with potential revenue differences reaching $335,000 annually for a $20 million revenue company [4]. This performance differential highlights the critical importance of selecting and optimizing the right performance indicators.
However, fractional CMO engagements also face inherent limitations that must be acknowledged. The temporary nature of these relationships can create challenges in long-term brand building and customer relationship development. Additionally, the external perspective, while valuable for strategic insights, may lack the deep institutional knowledge that full-time executives develop over extended tenures. These constraints make it essential for fractional CMOs to focus on metrics that deliver both immediate insights and sustainable long-term value.
Comprehensive Analysis of 10 Essential KPIs
The following analysis examines each essential KPI through multiple dimensions: definition and calculation methodology, industry benchmarks, strategic importance for fractional CMOs, implementation challenges, and optimization strategies. Each metric is evaluated using data from authoritative sources and real-world performance benchmarks.
| KPI | Primary Focus | Measurement Frequency | Strategic Priority | Implementation Complexity |
|---|---|---|---|---|
| Customer Acquisition Cost | Cost Efficiency | Monthly | High | Medium |
| Customer Lifetime Value | Long-term Value | Quarterly | High | High |
| Return on Marketing Investment | ROI Measurement | Monthly | Critical | High |
| Conversion Rate | Performance Optimization | Weekly | High | Low |
| Website Traffic Sources | Channel Attribution | Weekly | Medium | Low |
| Social Media Engagement | Brand Awareness | Daily | Medium | Low |
| Email Marketing Performance | Direct Engagement | Per Campaign | High | Low |
| Sales Qualified Leads | Pipeline Quality | Weekly | Critical | Medium |
| Brand Awareness Metrics | Market Presence | Monthly | Medium | High |
| Churn Rate | Retention | Monthly | High | Medium |
1. Customer Acquisition Cost (CAC)
Customer Acquisition Cost represents the total expense incurred to acquire a single new customer, calculated by dividing total marketing and sales expenses by the number of new customers acquired during a specific period. For fractional CMOs, CAC serves as a fundamental efficiency metric that directly impacts budget allocation and strategic decision-making.
Industry benchmarks reveal significant variation across sectors. According to Shopify’s 2025 analysis, CAC ranges from $21 in arts and entertainment to $377 in electronics, with health and beauty ($127), fashion and accessories ($129), and home and furniture ($129) clustering in the middle range [7]. These variations reflect industry-specific factors including product complexity, sales cycle length, and competitive intensity.
“The common benchmark for a good CAC is to keep it significantly lower than the LTV. Ideally, the CAC should be around 1/3 or 1/4 of the LTV.” – Industry Analysis, UserPilot Research [8]
For fractional CMOs, CAC optimization requires understanding the underlying drivers of acquisition costs within each industry context. Arts and entertainment achieves the lowest CAC due to highly shareable content with viral potential and strong organic growth through social media platforms. Conversely, electronics commands the highest CAC due to complex, expensive products requiring detailed technical information and comprehensive review processes.
Implementation challenges for fractional CMOs include establishing accurate attribution models, particularly in multi-touch customer journeys, and accounting for the full cost of acquisition including both direct marketing expenses and allocated overhead. The compressed timeline of fractional engagements makes it essential to establish baseline CAC measurements quickly and implement optimization strategies that can demonstrate improvement within quarterly review cycles.
Strategic optimization approaches include channel-specific CAC analysis to identify the most cost-effective acquisition sources, cohort-based tracking to understand how CAC varies by customer segment, and lifetime value integration to ensure acquisition investments align with long-term profitability goals. Fractional CMOs should also consider the temporal aspects of CAC, as initial acquisition costs may be higher during market entry or brand building phases but should decrease as marketing efficiency improves.
2. Customer Lifetime Value (CLV)
Customer Lifetime Value quantifies the total revenue expected from a single customer throughout their entire relationship with the business. This metric serves as the strategic counterbalance to CAC, enabling fractional CMOs to evaluate the long-term profitability of acquisition investments and guide retention strategy development.
The CLV to CAC ratio has become a critical benchmark for marketing efficiency. Industry standards suggest a healthy ratio of 3:1 or higher, meaning customer lifetime value should be at least three times the acquisition cost [8]. However, this ratio varies significantly by industry and business model, with subscription-based businesses often achieving higher ratios due to predictable recurring revenue streams.
For fractional CMOs, CLV calculation methodology must account for the specific characteristics of each business model. Simple CLV calculations multiply average purchase value by purchase frequency and customer lifespan, but sophisticated models incorporate discount rates, churn probability, and expansion revenue potential. The choice of calculation method significantly impacts strategic decision-making and resource allocation.
Implementation complexity arises from the need for comprehensive customer data integration across multiple touchpoints and systems. Many organizations lack the data infrastructure necessary for accurate CLV calculation, particularly in tracking customer behavior across digital and offline channels. Fractional CMOs must often work with incomplete data sets while building the systems necessary for more sophisticated analysis.
The temporal mismatch between CLV realization and fractional CMO engagement timelines creates additional challenges. While CLV represents long-term value creation, fractional CMOs typically operate within shorter engagement periods. This dynamic requires careful balance between optimizing for immediate performance improvements and establishing systems that support long-term value creation.
Strategic applications of CLV analysis include customer segment prioritization, where high-value segments receive disproportionate marketing investment, and retention program development targeting customers with the highest lifetime value potential. Fractional CMOs should also use CLV insights to inform product development and pricing strategies, ensuring that customer acquisition efforts align with sustainable business growth.
3. Return on Marketing Investment (ROMI)
Return on Marketing Investment measures the revenue generated from marketing activities relative to the cost of those activities, providing fractional CMOs with a direct assessment of marketing effectiveness and financial accountability. ROMI calculation follows the formula: ((Increase in sales revenue – increase in marketing expenses) / increase in marketing expenses) × 100.
Forbes research demonstrates the significant impact of strategic marketing leadership on ROMI performance. Experienced fractional CMOs achieve an average ROMI of 589%, compared to 550% for less experienced practitioners, representing a 64% improvement in net revenue generation [4]. This performance differential underscores the importance of strategic expertise in maximizing marketing investment returns.
Industry benchmarks for ROMI vary considerably by sector and marketing channel. HubSpot data indicates that for B2B brands, the highest ROI channels are website/blog/SEO efforts, paid social media content, and social media shopping tools. For B2C brands, email marketing, paid social media content, and content marketing deliver the strongest returns [5]. These channel-specific performance differences require fractional CMOs to develop sophisticated attribution models that accurately reflect multi-channel customer journeys.
The challenge of ROMI measurement lies in establishing accurate attribution and accounting for the temporal lag between marketing investment and revenue realization. Many marketing activities, particularly brand building and content marketing, generate returns over extended periods that may exceed typical fractional CMO engagement timelines. This dynamic requires careful consideration of both immediate and long-term impact measurement.
Fractional CMOs must also address the complexity of incremental versus total ROMI calculation. Incremental ROMI measures the additional revenue generated by specific marketing investments, while total ROMI evaluates the overall efficiency of marketing spend. The choice between these approaches significantly impacts strategic decision-making and budget allocation priorities.
Advanced ROMI analysis incorporates customer lifetime value considerations, enabling fractional CMOs to evaluate marketing investments based on long-term customer relationships rather than immediate transaction value. This approach is particularly important for businesses with high customer lifetime values or subscription-based revenue models, where initial acquisition costs may exceed immediate revenue but generate substantial long-term returns.
4. Conversion Rate
Conversion rate measures the percentage of website visitors or marketing qualified leads who complete a desired action, such as making a purchase, signing up for a newsletter, or requesting a consultation. This metric serves as a critical indicator of marketing message effectiveness and user experience optimization for fractional CMOs.
Harvard Business School research reveals that more than one in three marketing leaders cite conversion rates as a top KPI they prioritize tracking, while nearly two out of three marketers report that their average landing page conversion rate is less than 10% [1]. This widespread focus on conversion optimization reflects its direct impact on marketing efficiency and revenue generation.
Industry benchmarks demonstrate significant variation across sectors and channels. HubSpot data indicates that the average conversion rate across all e-commerce sites is under 2%, with health and beauty achieving the highest rates at 2.7% and luxury handbags recording the lowest at 0.4% [5]. Email marketing demonstrates superior conversion performance, with B2C brands achieving 2.8% conversion rates and B2B brands reaching 2.4% [5].
| Industry/Channel | Conversion Rate | Key Success Factors |
|---|---|---|
| Health and Beauty | 2.7% | Visual appeal, influencer credibility, customer testimonials |
| Email Marketing (B2C) | 2.8% | Personalization, segmentation, timing optimization |
| Email Marketing (B2B) | 2.4% | Value proposition clarity, lead nurturing, content relevance |
| E-commerce Average | 2.0% | User experience, product presentation, checkout optimization |
| Luxury Handbags | 0.4% | Brand prestige, exclusivity, extended consideration periods |
For fractional CMOs, conversion rate optimization requires a systematic approach to identifying and addressing performance bottlenecks throughout the customer journey. The compressed timeline of fractional engagements makes it essential to prioritize high-impact optimization opportunities that can deliver measurable improvements within quarterly review cycles.
Implementation challenges include establishing accurate conversion tracking across multiple touchpoints and devices, particularly in complex B2B sales cycles where conversions may occur through offline channels or extended timeframes. Fractional CMOs must also account for the quality of conversions, as higher conversion rates may not necessarily correlate with improved business outcomes if the converted leads are of lower quality.
Advanced conversion rate analysis incorporates micro-conversion tracking, enabling fractional CMOs to understand user behavior patterns and identify optimization opportunities throughout the customer journey. Micro-conversions might include email signups, content downloads, or product page views that indicate progression toward primary conversion goals.
Strategic optimization approaches include A/B testing of landing page elements, personalization based on traffic source and user behavior, and conversion funnel analysis to identify specific drop-off points. Fractional CMOs should also consider the relationship between conversion rate and customer lifetime value, as optimizing for conversion volume may not always align with long-term profitability goals.
5. Website Traffic Sources
Website traffic source analysis provides fractional CMOs with essential insights into channel effectiveness, attribution accuracy, and strategic resource allocation. This metric encompasses the breakdown of traffic from organic search, paid advertising, social media, direct visits, referral sites, and email marketing campaigns.
Current market dynamics emphasize the critical importance of traffic source diversification and mobile optimization. HubSpot research indicates that most marketers report mobile devices account for over half of their annual traffic, while 63% of consumers prefer to find information about brands and products on mobile devices [5]. This mobile-first reality requires fractional CMOs to evaluate traffic sources through a mobile-optimized lens.
Organic search continues to dominate traffic acquisition strategies, with Google controlling over 93.9% of global mobile search market share and 32.9% of internet users discovering new brands through search engines [5]. For fractional CMOs, this concentration underscores the importance of search engine optimization as a foundational traffic acquisition strategy, while also highlighting the risks of over-dependence on a single traffic source.
Industry benchmarks from Databox reveal significant variation in traffic volume across sectors. Apparel and footwear leads with 27.05K median monthly sessions, followed by eCommerce and marketplaces at 14.08K, while construction and consulting services record significantly lower volumes at 1.56K and 2.56K respectively [6]. These variations reflect industry-specific factors including purchase frequency, research intensity, and digital adoption rates.
The strategic value of traffic source analysis extends beyond volume measurement to include quality assessment and attribution accuracy. Different traffic sources typically demonstrate varying conversion rates, customer lifetime values, and engagement patterns. For example, direct traffic often indicates strong brand awareness and customer loyalty, while paid search traffic may demonstrate higher immediate conversion intent but lower long-term engagement.
Implementation complexity arises from the challenges of accurate cross-device and cross-channel attribution. Modern customer journeys frequently span multiple devices and touchpoints, making it difficult to assign conversion credit accurately to specific traffic sources. Fractional CMOs must implement sophisticated attribution models that account for the full customer journey while acknowledging the limitations of current tracking technologies.
Advanced traffic source analysis incorporates cohort-based performance evaluation, enabling fractional CMOs to understand how traffic quality varies by source over time. This approach is particularly valuable for identifying traffic sources that generate customers with higher lifetime values or lower churn rates, even if immediate conversion rates appear lower.
Strategic optimization requires balancing traffic diversification with efficiency maximization. While diversified traffic sources reduce risk and provide multiple growth opportunities, resource constraints may require fractional CMOs to prioritize the most effective channels during initial engagement phases. The key is establishing measurement systems that enable rapid identification of high-performing traffic sources while maintaining strategic flexibility for future expansion.
6. Social Media Engagement
Social media engagement encompasses metrics such as likes, shares, comments, mentions, and click-through rates across various social platforms. For fractional CMOs, these metrics serve as indicators of brand awareness, audience connection, and content effectiveness, while also providing insights into customer sentiment and community building success.
Industry benchmarks reveal the growing importance of social media in marketing strategy. HubSpot data indicates that 60% of video marketers list engagement rate as a top KPI, followed by conversion rate at 56% and click-through rate at 52% [5]. This prioritization reflects the direct correlation between social engagement and business outcomes, particularly in building brand awareness and driving traffic to owned media properties.
Databox research demonstrates significant variation in engagement rates across industries, ranging from 52.43% in consulting and professional services to 63.86% in eCommerce and marketplaces [6]. eCommerce achieves higher engagement rates due to interactive elements like product recommendations, user-generated content, and social shopping features that encourage active participation.
The strategic importance of social media engagement for fractional CMOs extends beyond vanity metrics to encompass measurable business impact. Social platforms serve as critical touchpoints in the customer journey, influencing brand perception, purchase decisions, and customer retention. However, the challenge lies in connecting social engagement metrics to concrete business outcomes such as lead generation and revenue attribution.
Implementation challenges include establishing consistent measurement standards across multiple platforms, each with unique engagement mechanics and algorithmic influences. Platform-specific optimization requirements mean that content and engagement strategies must be tailored to each channel’s characteristics while maintaining brand consistency and message coherence.
The temporal nature of social media engagement creates additional complexity for fractional CMOs operating within compressed timelines. Building authentic social communities and generating sustained engagement typically requires consistent, long-term effort that may extend beyond typical fractional engagement periods. This dynamic requires careful balance between immediate performance improvements and sustainable community building.
Advanced social media analysis incorporates sentiment analysis, share of voice measurement, and competitive benchmarking to provide comprehensive insights into brand positioning and market perception. These sophisticated metrics enable fractional CMOs to understand not just the volume of engagement but also the quality and context of audience interactions.
Strategic optimization approaches include content format experimentation, with short-form video emerging as the most leveraged media format by marketers, and community management strategies that encourage user-generated content and authentic brand advocacy [5]. Fractional CMOs should also consider the integration of social media engagement with broader marketing objectives, ensuring that social activities support lead generation, customer retention, and revenue growth goals.
7. Email Marketing Performance
Email marketing performance encompasses open rates, click-through rates, conversion rates, and unsubscribe rates, providing fractional CMOs with direct insights into audience engagement and message effectiveness. Email marketing consistently ranks among the highest ROI marketing channels, making performance optimization critical for fractional CMO success.
HubSpot research confirms email marketing’s superior performance, ranking as the top ROI channel for B2C brands and demonstrating conversion rates of 2.8% for B2C and 2.4% for B2B organizations [5]. These performance levels significantly exceed average website conversion rates, highlighting email marketing’s effectiveness in reaching engaged audiences with targeted messaging.
The strategic importance of email marketing for fractional CMOs lies in its direct attribution capabilities and immediate measurability. Unlike many marketing channels that require complex attribution modeling, email marketing provides clear performance metrics that can be tracked from send to conversion. This transparency makes email marketing an ideal channel for demonstrating rapid performance improvements during fractional engagements.
Implementation challenges include list quality management, deliverability optimization, and personalization at scale. Many organizations inherit email lists with varying quality levels, requiring fractional CMOs to balance list cleaning activities with engagement optimization. Deliverability issues can significantly impact performance metrics, making technical optimization a critical component of email marketing success.
Advanced email marketing analysis incorporates lifecycle stage segmentation, enabling fractional CMOs to tailor messaging and measurement approaches based on customer journey position. New subscriber engagement patterns differ significantly from long-term customer behavior, requiring sophisticated segmentation strategies that account for these variations.
Strategic optimization approaches include automated drip campaigns, behavioral trigger sequences, and dynamic content personalization. Fractional CMOs should also consider email marketing’s role in supporting other marketing channels, such as social media promotion and content marketing distribution, to maximize overall marketing ecosystem effectiveness.
8. Sales Qualified Leads (SQL)
Sales Qualified Leads represent prospects who have been evaluated and deemed ready for direct sales engagement based on specific criteria including budget, authority, need, and timeline. For fractional CMOs, SQL generation and quality serve as critical indicators of marketing and sales alignment effectiveness.
The strategic importance of SQL measurement lies in its direct connection to revenue generation and sales team productivity. Unlike marketing qualified leads (MQLs), which may require additional nurturing, SQLs represent immediate sales opportunities that can generate short-term revenue impact within fractional CMO engagement timelines.
Industry benchmarks for SQL conversion rates vary significantly by sector and sales cycle complexity. B2B organizations typically experience longer qualification processes and lower conversion rates compared to B2C businesses, but generate higher average deal values that justify extended nurturing investments.
Implementation challenges include establishing clear qualification criteria that align marketing and sales team expectations, implementing lead scoring systems that accurately predict sales readiness, and maintaining data quality throughout the lead management process. Many organizations struggle with lead handoff processes that result in qualified leads being inadequately followed up by sales teams.
The temporal mismatch between lead generation and sales conversion creates additional complexity for fractional CMOs. While marketing activities may generate SQLs quickly, the sales process may extend beyond fractional engagement periods, making it difficult to demonstrate complete ROI attribution.
Advanced SQL analysis incorporates lead source attribution, qualification timeline tracking, and sales conversion rate measurement by lead characteristics. This comprehensive approach enables fractional CMOs to optimize both lead generation strategies and qualification processes to improve overall sales pipeline efficiency.
9. Brand Awareness Metrics
Brand awareness metrics include social mentions, search volume for brand terms, direct traffic levels, and survey-based awareness measurements. These metrics provide fractional CMOs with insights into market presence and competitive positioning, though they often require longer timeframes to demonstrate significant improvement.
The challenge of brand awareness measurement for fractional CMOs lies in the extended timeline typically required for meaningful brand building activities. While tactical marketing improvements can demonstrate results within months, brand awareness development often requires sustained effort over multiple years.
Implementation approaches include social listening tools for mention tracking, search volume analysis for brand term performance, and direct traffic monitoring as an indicator of brand recall. However, these metrics can be influenced by factors beyond marketing control, including public relations activities, customer service experiences, and competitive actions.
Strategic optimization requires balancing short-term performance improvements with long-term brand building investments. Fractional CMOs must carefully evaluate which brand awareness activities can demonstrate measurable progress within engagement timelines while establishing systems for continued monitoring and optimization.
10. Churn Rate
Churn rate measures the percentage of customers who discontinue their relationship with the business during a specific period. For fractional CMOs, churn rate serves as a critical indicator of customer satisfaction, product-market fit, and long-term business sustainability.
The strategic importance of churn rate extends beyond customer retention to encompass customer lifetime value optimization and acquisition strategy effectiveness. High churn rates can undermine customer acquisition investments, making retention optimization a critical component of overall marketing strategy.
Industry benchmarks for churn rates vary significantly by business model and sector. Subscription-based businesses typically experience monthly churn rates ranging from 2% to 8%, while transactional businesses may measure churn on annual or purchase cycle bases.
Implementation challenges include defining churn criteria consistently, accounting for different customer segments with varying expected engagement patterns, and establishing early warning systems that enable proactive retention interventions.
Advanced churn analysis incorporates predictive modeling to identify at-risk customers before they actually churn, enabling fractional CMOs to implement targeted retention campaigns. This proactive approach can significantly improve retention rates while providing measurable performance improvements within fractional engagement timelines.
Visual Framework: KPI Dashboard Implementation
Effective KPI management for fractional CMOs requires sophisticated visualization and dashboard systems that enable rapid performance assessment and strategic decision-making. The compressed timeline of fractional engagements makes visual clarity and real-time data access essential for demonstrating value and optimizing performance.
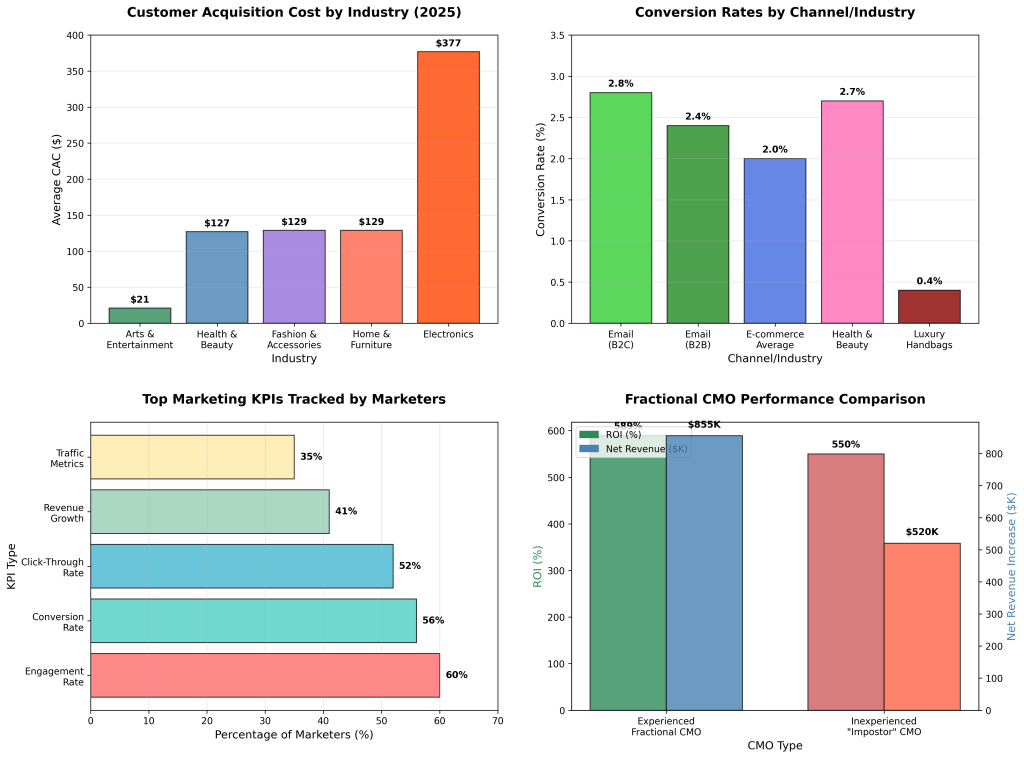
The visual framework above demonstrates the interconnected nature of essential KPIs and their relative performance across industries. Customer acquisition costs vary dramatically from $21 in arts and entertainment to $377 in electronics, while conversion rates show similar industry-specific patterns. The fractional CMO ROI comparison illustrates the significant performance differential between experienced and inexperienced practitioners, with experienced fractional CMOs achieving 589% ROI compared to 550% for less experienced alternatives.
Dashboard Architecture Principles
Effective KPI dashboards for fractional CMOs must balance comprehensive coverage with actionable simplicity. The dashboard architecture should prioritize metrics that directly influence strategic decision-making while providing drill-down capabilities for detailed analysis. Key architectural principles include real-time data integration, mobile optimization for on-the-go access, and customizable views that accommodate different stakeholder needs.
The primary dashboard view should feature the most critical KPIs prominently, including customer acquisition cost, conversion rates, return on marketing investment, and sales qualified leads. Secondary metrics such as social media engagement and brand awareness can be accessible through navigation tabs or expandable sections that don’t clutter the primary view.
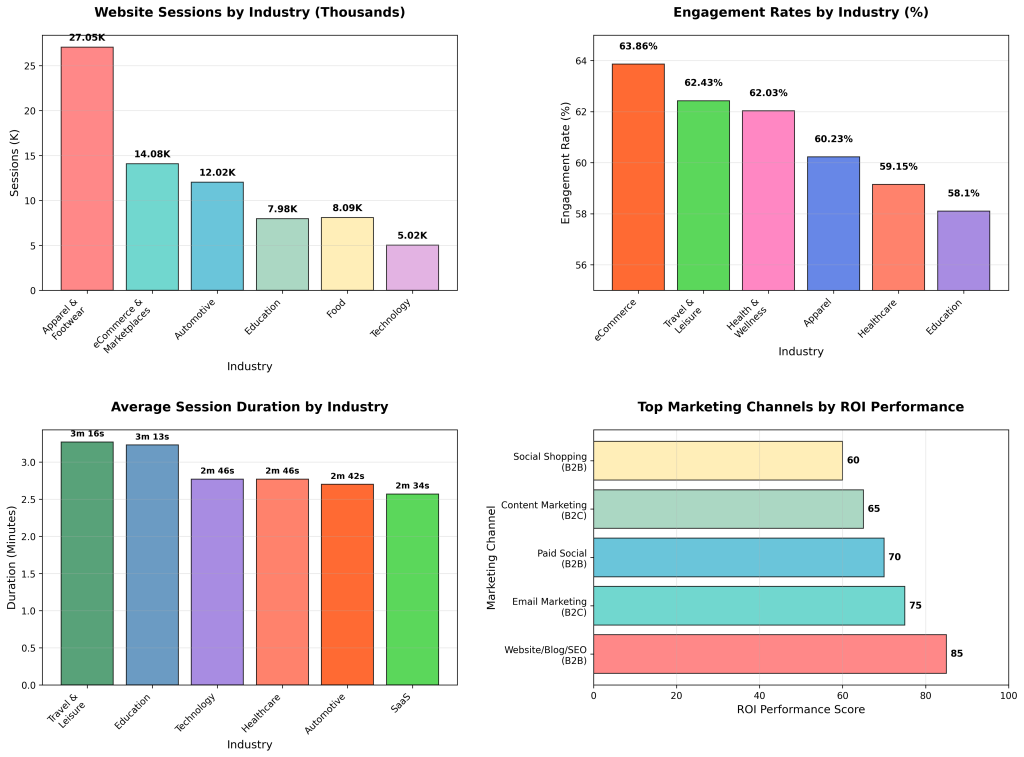
The industry metrics visualization reveals significant performance variations across sectors that fractional CMOs must consider when establishing benchmarks and optimization targets. Apparel and footwear demonstrates the highest session volumes at 27.05K, while eCommerce achieves the highest engagement rates at 63.86%. These variations underscore the importance of industry-specific benchmarking rather than universal KPI targets.
Data Integration and Automation
Successful KPI dashboard implementation requires robust data integration capabilities that connect multiple marketing and sales systems. Common integration points include Google Analytics for website performance, CRM systems for lead and customer data, email marketing platforms for campaign performance, and social media management tools for engagement metrics.
Automation plays a critical role in maintaining dashboard accuracy and reducing manual reporting overhead. Automated data refresh schedules ensure that KPI displays reflect current performance, while alert systems can notify fractional CMOs of significant performance changes or threshold breaches that require immediate attention.
The technical implementation should prioritize data accuracy over real-time updates, as incorrect information can lead to poor strategic decisions. Data validation processes and error handling mechanisms are essential components of reliable dashboard systems that fractional CMOs can trust for critical decision-making.
Stakeholder Communication and Reporting
KPI dashboards serve multiple stakeholder groups with varying information needs and technical sophistication levels. Executive stakeholders typically require high-level performance summaries with clear trend indicators and benchmark comparisons. Marketing team members need detailed performance data that enables tactical optimization and campaign management.
Effective dashboard design incorporates multiple view levels that accommodate these different stakeholder needs without overwhelming any particular user group. Executive summary views should emphasize key performance trends and strategic insights, while detailed operational views provide the granular data necessary for day-to-day optimization activities.
Regular reporting schedules and automated distribution ensure that stakeholders receive consistent performance updates without requiring manual dashboard access. Weekly operational reports can highlight immediate optimization opportunities, while monthly strategic reports provide broader performance context and trend analysis.
Performance Benchmarking and Competitive Analysis
Effective KPI dashboards incorporate industry benchmarking capabilities that enable fractional CMOs to evaluate performance relative to sector standards and competitive positioning. Benchmark data should be updated regularly to reflect current market conditions and industry evolution.
Competitive analysis features can provide additional context for performance evaluation, though data availability may be limited depending on industry transparency and competitive intelligence capabilities. Where possible, dashboards should incorporate market share indicators, competitive pricing intelligence, and industry trend data that inform strategic decision-making.
The benchmarking framework should account for business size, market maturity, and competitive intensity factors that influence performance expectations. A startup in a emerging market may demonstrate different performance patterns compared to an established business in a mature sector, requiring adjusted benchmark standards and optimization priorities.
Strategic Action Plan: Implementation Roadmap
Successful KPI implementation for fractional CMOs requires a systematic approach that balances immediate performance improvements with sustainable long-term systems development. The following roadmap provides a structured framework for establishing comprehensive KPI monitoring within typical fractional engagement timelines.
Phase 1: Foundation and Assessment (Weeks 1-4)
The initial phase focuses on establishing baseline measurements and identifying immediate optimization opportunities. Fractional CMOs must rapidly assess existing data infrastructure, measurement capabilities, and performance levels to establish a foundation for strategic improvement.
| Activity | Timeline | Key Deliverables | Success Criteria |
|---|---|---|---|
| Data Infrastructure Audit | Week 1 | System inventory, data quality assessment | Complete mapping of data sources and integration points |
| Baseline KPI Measurement | Week 2 | Current performance metrics, historical trends | Established baseline for all 10 essential KPIs |
| Industry Benchmark Research | Week 2 | Competitive analysis, industry standards | Documented performance gaps and opportunities |
| Quick Win Identification | Week 3 | Priority optimization opportunities | Actionable improvement plan with 30-day targets |
| Dashboard Setup | Week 4 | Basic KPI dashboard, reporting schedule | Functional dashboard with automated data updates |
Critical success factors for Phase 1 include securing stakeholder buy-in for measurement initiatives, establishing clear data governance protocols, and identifying technical resources necessary for dashboard implementation. Fractional CMOs must also address any immediate data quality issues that could compromise measurement accuracy.
Phase 2: Optimization and Refinement (Weeks 5-12)
The optimization phase focuses on implementing improvements identified during the assessment period while refining measurement approaches based on initial results. This phase typically generates the most visible performance improvements and demonstrates the value of systematic KPI management.
Key activities include conversion rate optimization through A/B testing, customer acquisition cost reduction through channel optimization, and email marketing performance improvement through segmentation and personalization. Each optimization initiative should include clear success metrics and timeline expectations that align with overall engagement objectives.
Advanced analytics implementation begins during this phase, including cohort analysis for customer lifetime value assessment, attribution modeling for multi-channel customer journeys, and predictive analytics for churn prevention. These sophisticated measurement approaches provide deeper insights that support strategic decision-making beyond basic performance monitoring.
Phase 3: Scaling and Systematization (Weeks 13-24)
The scaling phase emphasizes sustainable systems development and knowledge transfer to ensure continued optimization beyond the fractional engagement period. This phase is critical for organizations seeking to maintain performance improvements and continue strategic development independently.
Systematic optimization processes include automated testing protocols, performance alert systems, and regular optimization review cycles that maintain continuous improvement momentum. Documentation of successful optimization strategies and decision-making frameworks enables internal teams to continue strategic development effectively.
Knowledge transfer activities include training internal team members on dashboard utilization, optimization methodologies, and strategic analysis techniques. Comprehensive documentation ensures that institutional knowledge developed during the fractional engagement remains accessible for future strategic initiatives.
ROI Measurement and Validation Framework
Effective ROI measurement requires establishing clear attribution methodologies that connect KPI improvements to business outcomes. The measurement framework should account for both immediate performance improvements and long-term value creation that may extend beyond the fractional engagement period.
| Measurement Period | Key Metrics | Calculation Method | Expected Outcomes |
|---|---|---|---|
| 30-Day Quick Wins | Conversion rate, email performance | Direct attribution to optimization activities | 5-15% improvement in targeted metrics |
| 90-Day Strategic Impact | CAC, ROMI, SQL generation | Incremental revenue vs. investment | 20-40% improvement in efficiency metrics |
| 6-Month Transformation | CLV, churn rate, brand awareness | Total business impact assessment | 300-600% ROI on fractional CMO investment |
| 12-Month Sustainability | Revenue growth, market share | Long-term value creation analysis | Sustained performance improvement |
The ROI validation framework incorporates both quantitative performance improvements and qualitative organizational development outcomes. While quantitative metrics provide clear performance indicators, qualitative improvements in marketing sophistication, team capabilities, and strategic thinking often generate long-term value that exceeds immediate performance gains.
Risk Mitigation and Contingency Planning
Effective implementation planning must account for potential challenges and obstacles that could compromise KPI optimization success. Common risk factors include data quality issues, technical integration challenges, stakeholder resistance, and resource constraints that limit implementation scope.
Contingency planning should include alternative measurement approaches for situations where ideal data sources are unavailable, simplified optimization strategies for resource-constrained environments, and stakeholder communication protocols that maintain engagement momentum despite temporary setbacks.
The risk mitigation framework should also address the temporal challenges inherent in fractional CMO engagements, including the need to demonstrate value quickly while building sustainable long-term systems. Balancing these competing priorities requires careful planning and clear stakeholder expectations about realistic timeline and outcome expectations.
Future Outlook: Emerging Trends and Challenges
The fractional CMO landscape continues to evolve rapidly, driven by technological advancement, changing consumer behavior, and economic pressures that favor flexible executive arrangements. Understanding emerging trends and potential challenges enables fractional CMOs to adapt their KPI strategies and maintain competitive advantage in an increasingly sophisticated market.
Artificial Intelligence and Marketing Automation
The integration of artificial intelligence into marketing operations represents a fundamental shift in KPI measurement and optimization capabilities. HubSpot research indicates that 75% of marketers believe AI-enabled search engines will positively impact their blogs, while 68% predict increased site traffic from AI integration [5]. These developments require fractional CMOs to adapt measurement frameworks that account for AI-driven optimization and attribution complexity.
Advanced AI applications include predictive customer lifetime value modeling, automated churn prevention systems, and dynamic pricing optimization that responds to real-time market conditions. These capabilities enable more sophisticated KPI optimization but also require enhanced technical expertise and data infrastructure investments that may challenge traditional fractional CMO engagement models.
The democratization of AI tools also creates opportunities for smaller organizations to implement sophisticated marketing analytics previously available only to large enterprises. Fractional CMOs must stay current with emerging AI capabilities while maintaining focus on fundamental performance measurement principles that drive business results.
Privacy Regulation and Data Limitations
Evolving privacy regulations and platform policy changes continue to impact marketing measurement capabilities, requiring fractional CMOs to develop attribution strategies that function effectively within constrained data environments. The deprecation of third-party cookies and increased privacy controls limit traditional tracking methodologies, necessitating alternative measurement approaches.
First-party data collection and utilization become increasingly critical for accurate KPI measurement and customer understanding. Fractional CMOs must prioritize data collection strategies that build comprehensive customer profiles while respecting privacy preferences and regulatory requirements.
The shift toward privacy-first measurement also emphasizes the importance of direct customer relationships and owned media properties. Email marketing, customer surveys, and direct feedback mechanisms gain strategic importance as alternative data sources for performance measurement and optimization.
Economic Uncertainty and Budget Optimization
Economic volatility and budget constraints increase pressure on fractional CMOs to demonstrate clear ROI and optimize marketing efficiency. Organizations facing financial pressure prioritize marketing investments that generate immediate, measurable returns, potentially limiting long-term brand building activities.
This environment favors fractional CMO arrangements that emphasize performance-based compensation and clear accountability metrics. KPI frameworks must balance short-term performance optimization with sustainable long-term growth strategies that maintain competitive positioning during economic recovery periods.
The emphasis on efficiency also drives adoption of marketing technology solutions that automate routine optimization activities, enabling fractional CMOs to focus on strategic initiatives that generate maximum business impact within compressed engagement timelines.
Channel Diversification and Attribution Complexity
The proliferation of marketing channels and touchpoints continues to complicate attribution modeling and performance measurement. Emerging platforms, social commerce capabilities, and interactive media formats require sophisticated measurement approaches that account for complex customer journey patterns.
Cross-device and cross-platform customer behavior creates additional attribution challenges that traditional measurement models struggle to address accurately. Fractional CMOs must implement measurement frameworks that provide actionable insights despite attribution limitations and data fragmentation.
The solution involves developing measurement approaches that emphasize directional insights and relative performance comparisons rather than precise attribution. This pragmatic approach enables strategic decision-making while acknowledging the inherent limitations of current measurement technologies.
Key Takeaways
- Strategic KPI Selection Drives Performance: Experienced fractional CMOs achieve 589% ROI compared to 550% for less experienced practitioners, demonstrating a 64% improvement in net revenue generation through strategic metric focus and optimization expertise.
- Industry-Specific Benchmarking Is Essential: Customer acquisition costs vary dramatically from $21 in arts and entertainment to $377 in electronics, while conversion rates range from 0.4% in luxury goods to 2.8% in email marketing, requiring tailored performance expectations and optimization strategies.
- Rapid Implementation Generates Immediate Value: The compressed timeline of fractional engagements necessitates systematic KPI implementation that delivers measurable improvements within 30-90 day cycles while building sustainable long-term optimization capabilities.
- Data Integration and Automation Enable Scale: Successful KPI management requires sophisticated dashboard systems that integrate multiple data sources, provide real-time performance insights, and automate routine reporting to maximize strategic focus and decision-making efficiency.
- ROI Measurement Validates Investment: Comprehensive ROI frameworks that connect KPI improvements to business outcomes demonstrate the substantial value potential of fractional CMO engagements, with potential revenue differences reaching $335,000 annually for mid-market organizations.
Frequently Asked Questions
What is the minimum engagement period required to demonstrate meaningful KPI improvements?
Most fractional CMO engagements require a minimum of 6 months to demonstrate substantial KPI improvements and ROI validation. While quick wins can be achieved within 30-90 days, sustainable performance improvements and system development typically require longer engagement periods to ensure lasting impact.
How do fractional CMOs handle attribution challenges in multi-channel customer journeys?
Experienced fractional CMOs implement sophisticated attribution models that emphasize directional insights and relative performance comparisons rather than precise attribution. This approach includes first-party data collection, cohort analysis, and incremental testing methodologies that provide actionable insights despite measurement limitations.
What data infrastructure is required to support comprehensive KPI monitoring?
Effective KPI monitoring requires integration of multiple systems including Google Analytics, CRM platforms, email marketing tools, and social media management systems. The specific requirements vary by organization size and complexity, but automated data integration and dashboard capabilities are essential for efficient performance management.
How do industry benchmarks influence KPI target setting for fractional CMOs?
Industry benchmarks provide essential context for realistic target setting and performance evaluation. However, fractional CMOs must account for organization-specific factors including business model, market maturity, and competitive positioning when establishing KPI targets and optimization priorities.
What are the most common implementation challenges for fractional CMO KPI programs?
Common challenges include data quality issues, technical integration complexity, stakeholder resistance to measurement initiatives, and resource constraints that limit implementation scope. Successful programs address these challenges through systematic planning, stakeholder education, and phased implementation approaches that demonstrate value quickly.
References
- Harvard Business School. (2024). “7 Marketing KPIs Your Business Should Track.” Harvard Business School Online.
- Greenberg, O. (2024). “Is ‘Fractional CMO’ a buzz term?” LinkedIn Professional Analysis.
- Harvard Business Review. (2024). “Driving Strategic Business Growth with a Fractional CMO.” Meld Marketing Analysis.
- Ayar, F. (2023). “The ROI Of A Fractional CMO.” Forbes Business Council.
- HubSpot. (2025). “Marketing Statistics: Data and Trends for 2025.” HubSpot State of Marketing Report.
- Databox. (2025). “Industry-Specific Marketing Benchmarks to Compare Your Performance.” Databox Research.
- Shopify. (2025). “Customer Acquisition Costs by Industry (2025).” Shopify Business Analysis.
- UserPilot. (2024). “Average Customer Acquisition Cost: Benchmarks by Industry.” UserPilot Research.
- Gartner. (2024). “Marketing ROI Metrics and Measurement Strategies.” Gartner Research.
- Chief Outsiders. (2023). “Leveraging Fractional CMO Services: Revealing the Impact through Statistics.” MOG Experience Research.